Insights
The Insights feature aims at providing actionable information related to your devices.
This feature requires Famoco Layer version 3.7.0 or above. While older devices can provide some Insights metrics, to get the full experience of this feature Android 8 or above is required.
Context
Insights aims to solve challenges you might face when deploying fleets of devices in the field:
Challenge 1
Challenge 2
Challenge 3
What type of data does Insights collect about my devices?
To date, Insights collects 4 types of data points:
- Battery data: see recent data about battery levels and their charging state for your devices
- App Activity data: analyse the activity of your devices and how it evolves through time, identify your top performers, and see how your applications are being used
- Location data: track movement of devices and analyse heatmaps of presence and activity
- Network data: track data usage of your devices and identify possible connectivity issues or less optimal deployment areas
Managing dashboards
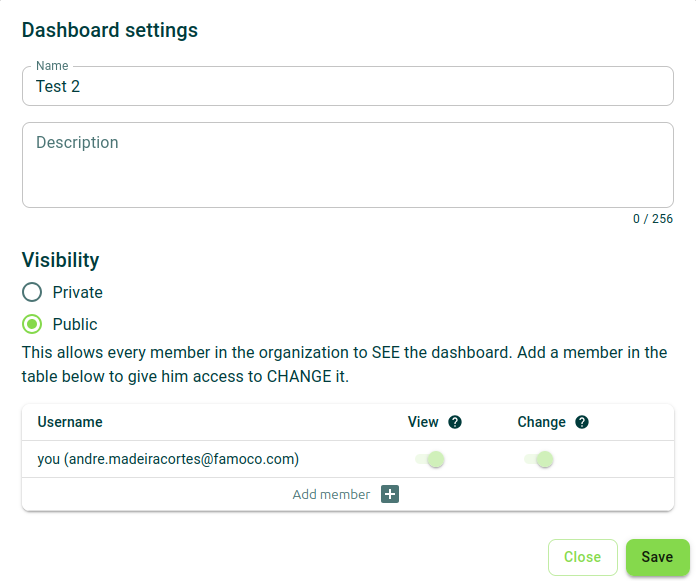
When creating or editing the settings of a dashboard, you need to name it and optionally give it a description in order to help other users to understand its content.
Additionally, you need to set the visibility of the dashboard:
- Private: you decide which users are able to see and/or edit this dashboard;
- Public: everyone in your MDM organization is able to see the dashboard, but you can pick users in order to allow them to edit it too.
Editing contents of a dashboard
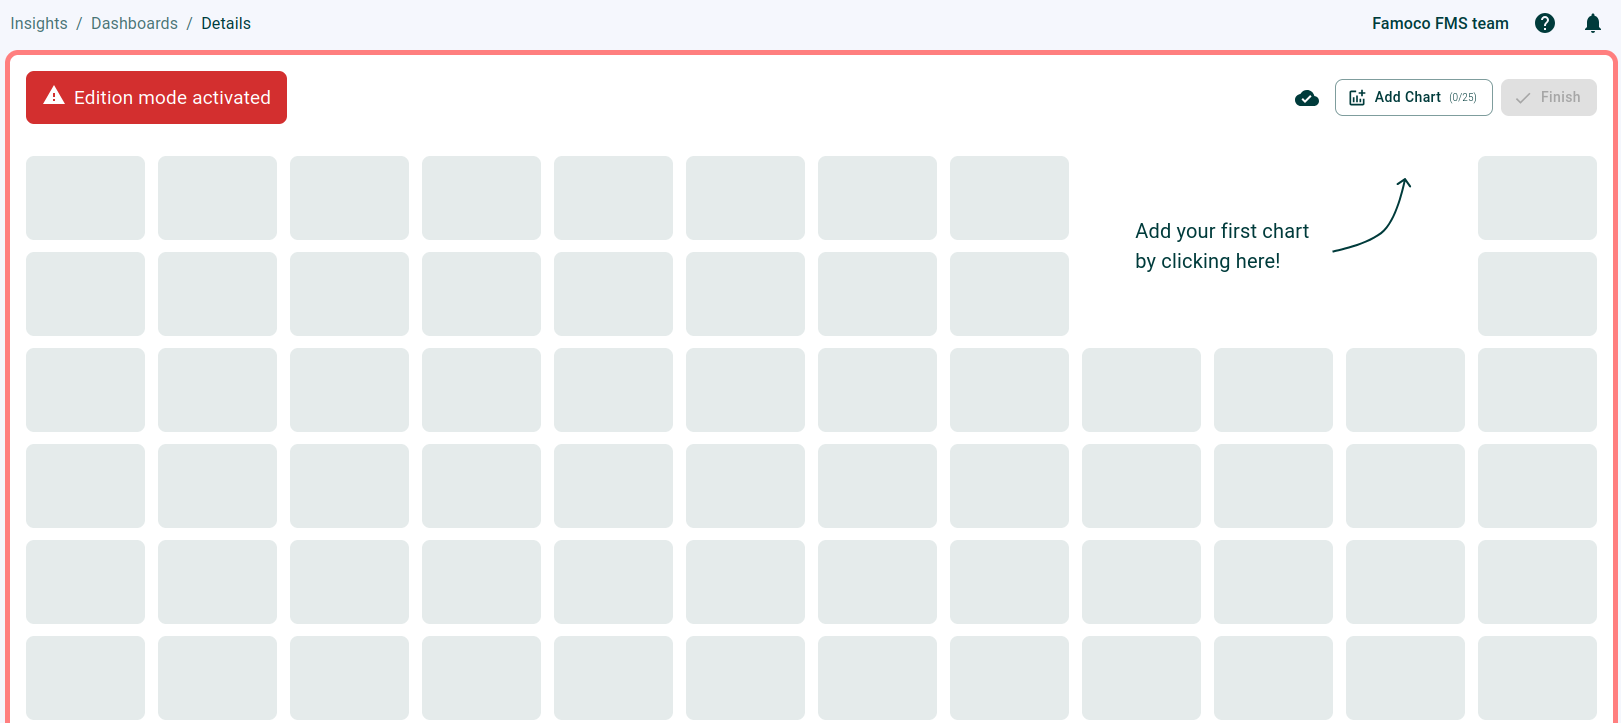
If you have the permission to edit a dashboard, press the "Modify Dashboard".
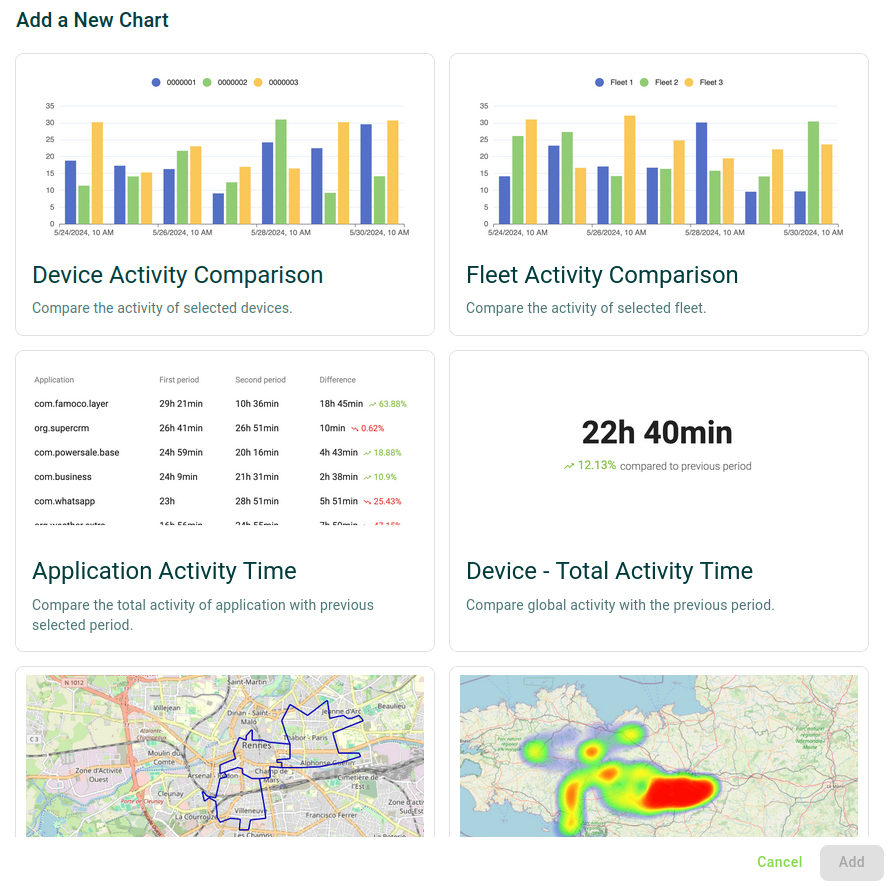
On the top right corner, the button "Add Chart" allows you to see a complete list of the available charts that Insights provides. Clicking on one of them and clicking "Add" will provide that chart on your dashboard.
Once you are done, press "Finish" to end your editing session.
When highlighting a chart, a toolbox is displayed in order to apply some transformations on it:
- Refresh the chart
- Remove the chart from your dashboard
- Apply filters to the chart
- Expand the chart to see explore it better


